/01
The Problem
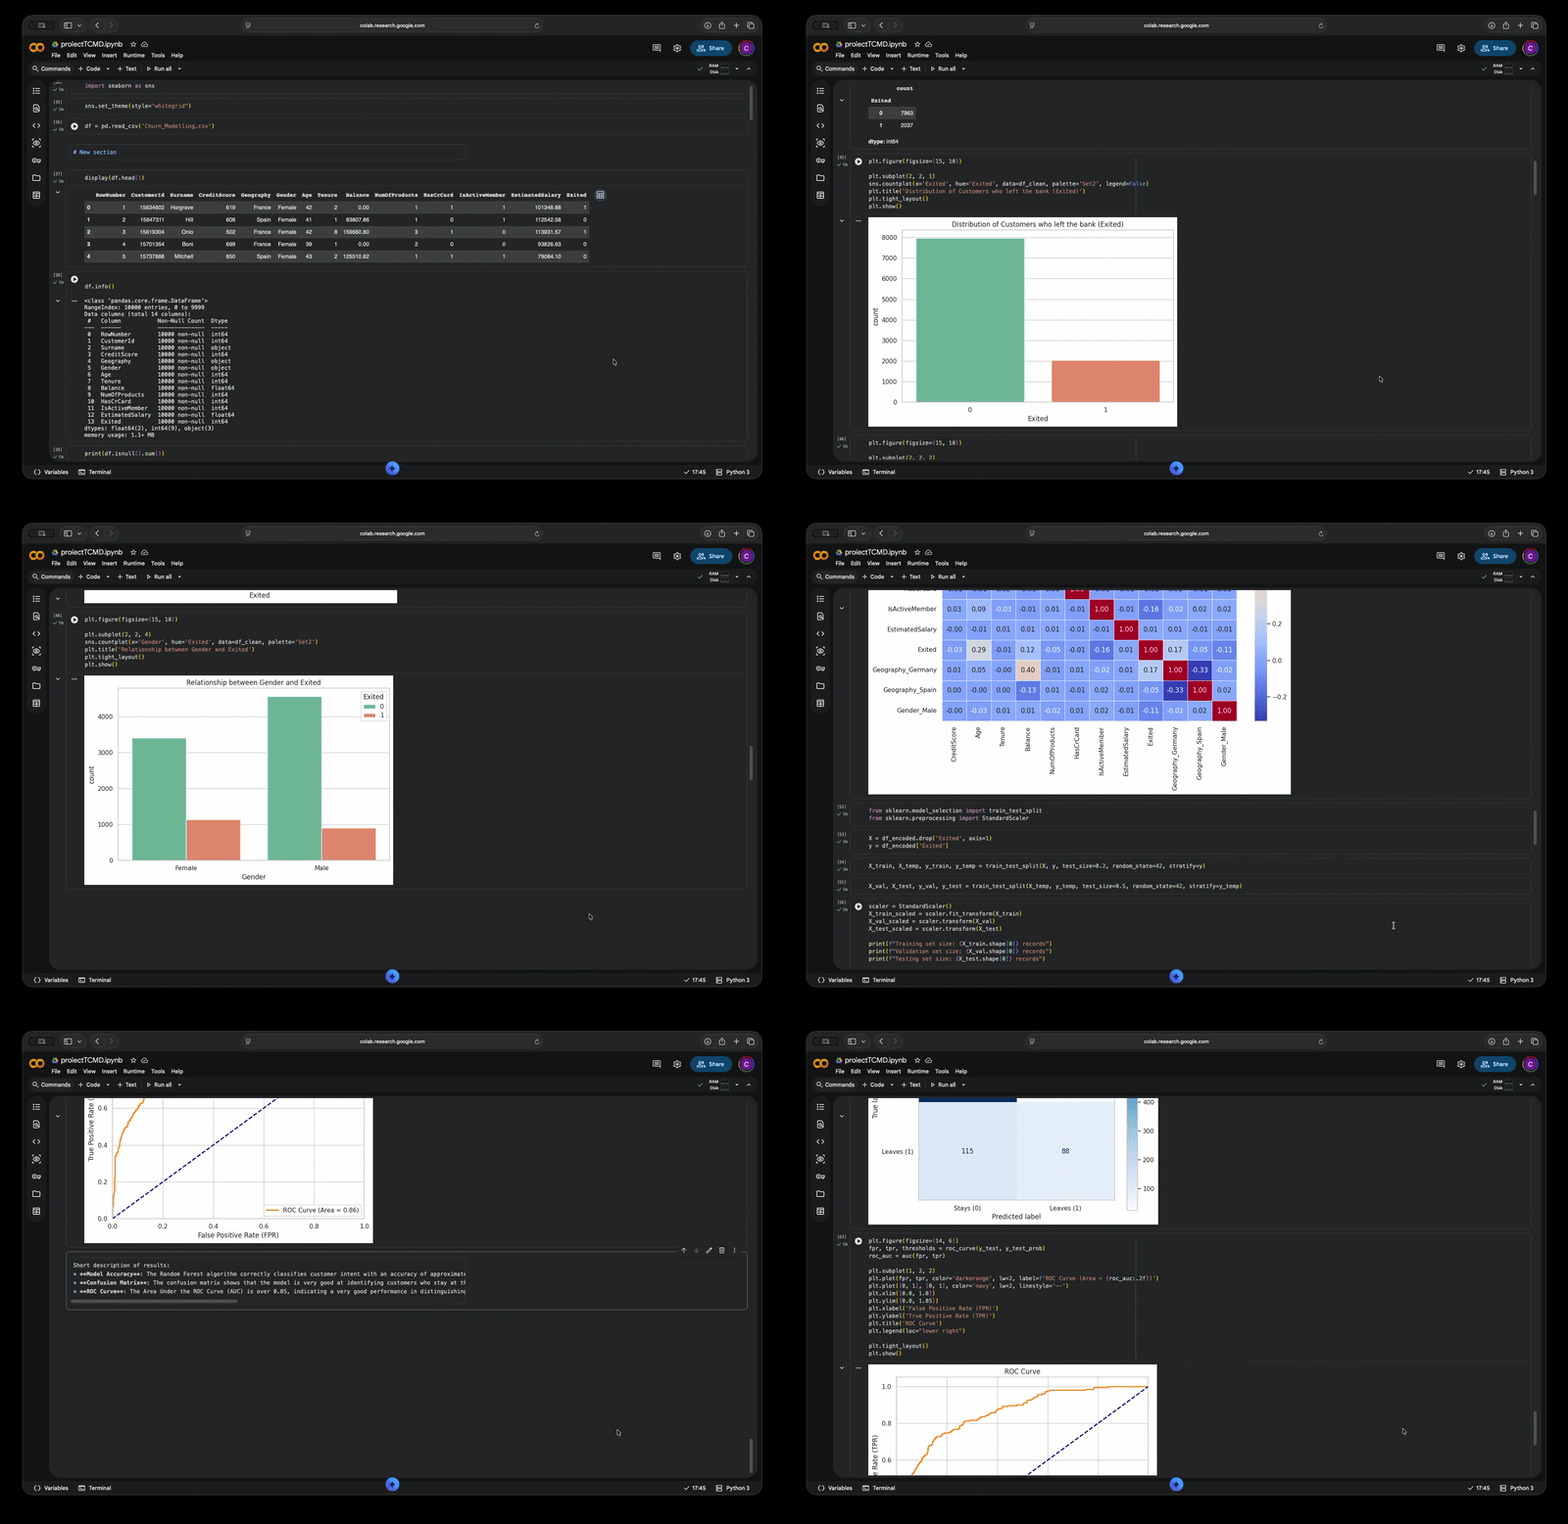
Banks lose significant revenue when customers quietly churn, often without any warning signs the business is tracking. I wanted to find out which customer signals actually predict churn, using a real 10,000-record banking dataset.
/02
What I Did
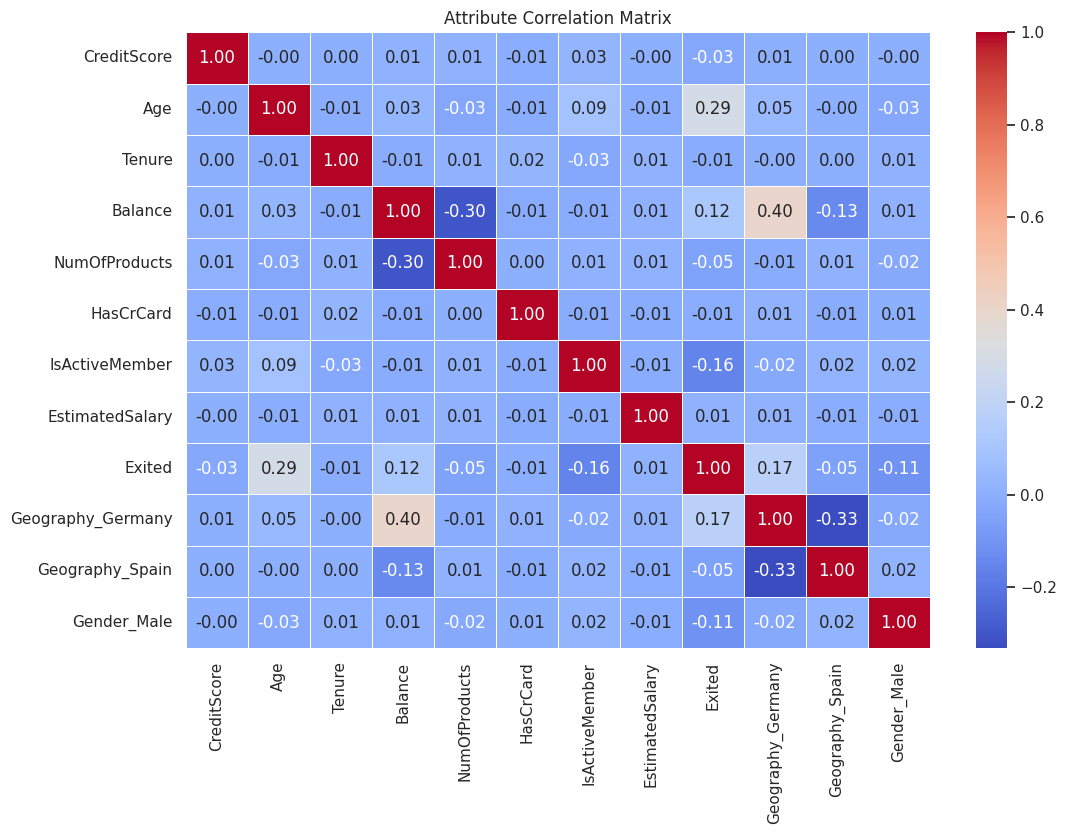
I cleaned and prepared the data with pandas and NumPy, then built exploratory visualizations — distribution plots, boxplots, and a correlation heatmap — to understand how age, account balance, and number of products related to churn before building any model. I trained a Random Forest classifier with scikit-learn, choosing it for its strong balance of interpretability and performance on tabular data, and validated it with a proper train/validation/test split and feature scaling.
/03
What I Found
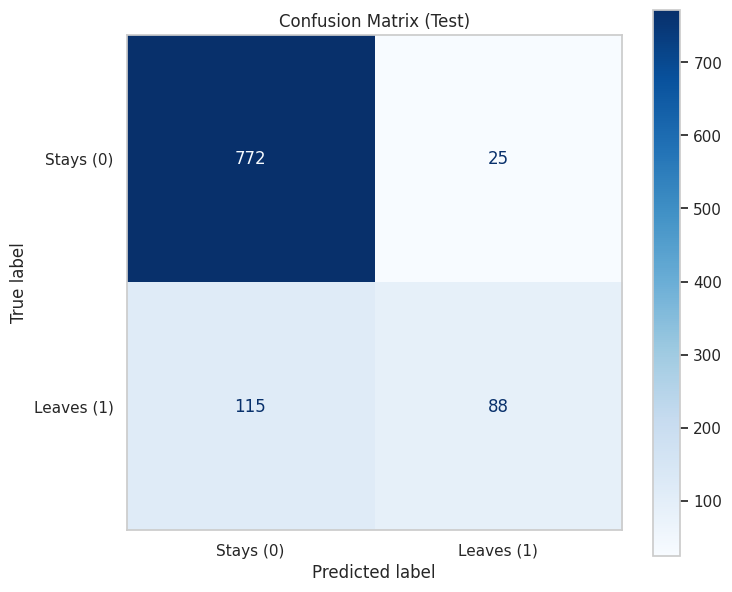
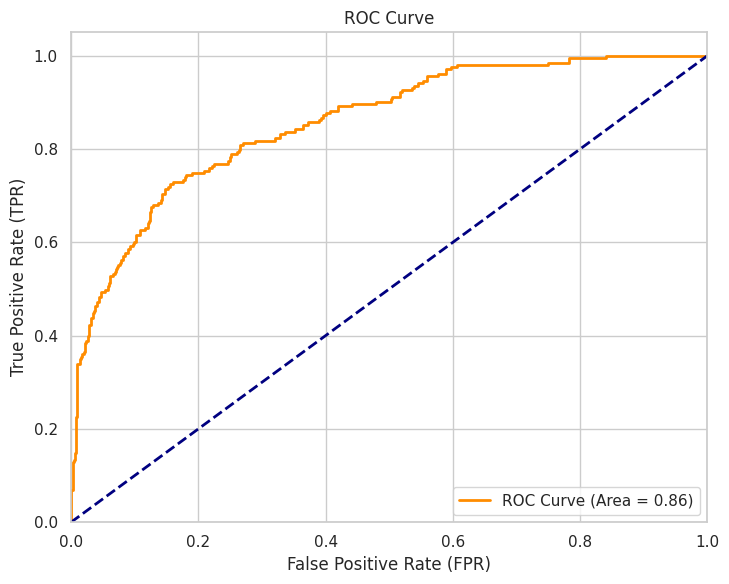
The model reached ~86-87% accuracy and a 0.86 ROC-AUC on the held-out test set. Using the confusion matrix and classification report, I identified age, number of products, and account balance as the strongest predictors of churn.
/TRADE-OFFS & CONSTRAINTS
The dataset was static and 10K rows — enough to validate the modeling approach, but not to catch drift or seasonal churn patterns a live production feed would surface. I picked Random Forest over gradient boosting deliberately: on a dataset this size, the interpretability gain (clean feature importances for stakeholders) mattered more than squeezing out another point or two of AUC. Next step would be re-running this against a live pipeline and comparing against XGBoost with proper hyperparameter tuning.
Curious about the other projects?
Back to work